
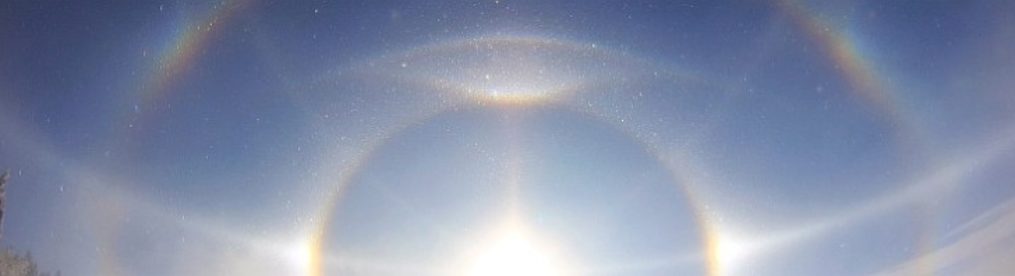
The antisolar (or subanthelic) arc (AA) was one out of the vast range of halo species occurring during the marvelous Neklid display observed by Claudia and Wolfgang Hinz on Jan 30th, 2014. This kind of halo seems to be exceedingly rare, since it has only been documented during the very best displays, mostly observed in Antarctica. On the other hand, the heliac arc (HA) is a, however not frequent, but well-known guest in Central Europe. Both of them are reflection halos generated by Parry oriented crystals and touch each other at the vertices of their large loops. Fisheye photos towards the zenith from Neklid shows both these halos in perfect symmetry and approximately similar intensity, at least regarding the upper part of the AA.
When trying to simulate the display (solar elevation 17.5°) using HaloPoint2.0, I noticed that the AA was rendered much weaker than the HA, which of course does not match the photographic data. To obtain the Parry effects (Parry arcs, Tape arcs, HA, AA, Hastings arc, partially circumzenith arc, Tricker arc, subhelic arc) I chose a population of “normal” (i.e. symmetrically hexagonal) column crystals with a length/width ratio of c/a = 2 in the appropriate orientation. Since both HA and AA are generated by this very same crystal population, their mutual intensity ratio cannot be influenced by adding plates, singly ordered columns, or randomly oriented crystals. This mysterious issue has also been noted by a Japanese programmer who came across the Neklid pictures.
Inclusions of air or solid particles within the ice crystals are an obvious hypothesis to explain this dissenting AA/HA intensity ratio, since they cannot be accounted for in the standard simulation software. However, a look into literature reveals that there are external and internal ray paths for the HA, but only internal paths for the AA ([1] p. 34-35). That means that inclusions will diminish the AA to a greater extent than the HA. In the extreme case with the interior totally blocked, no AA can arise but a HA is still possible due to external reflection at a sloping crystal face. Hence inclusions cannot explain the bright AA from the Neklid display. Air cavities at the ends of columns which are seen quite often in crystal samples will also inhibit the AA because an internal reflection at a well defined end face is needed for its formation.
Spatial inhomogeneities in the crystal distribution might serve as explanation as long as there is only one single photo or display to deal with, especially when the air flow conditions are as special as they were at Neklid. Maybe there were just “more“ good crystals in the direction of the AA compared to where the HA is formed, either by chance or systematically due to the wind regime. But surprisingly also the observations from the South Pole (Jan 21st, 1986 (Walter Tape); Jan 11th, 1999 (Marko Riikonen), also discussed here) show an AA/HA ratio somewhere in the region of unity as far as one can guess from the printed reproductions ([1] p. 30, [2] p. 58). Parts of the AA appeared even brighter than the HA in Finnish spotlight displays. All this implies a deeper reason for the AA brightening. It seems rather unlikely that in all these cases the inhomogeneities should have worked only in favor of the AA.
Hence the crystals themselves must be responsible for AA brightening. Non-standard crystal shapes and orientations are conjectures that can be tested easily with the available simulation programs. For a first try, one can assign a Parry orientation to plates instead of columns. Changing the c/a shape ratio from 2 to 0.5 while keeping all other parameters fixed results in a much brighter AA.
It is, however, commonly accepted that due to the air drag only columns can acquire a Parry orientation ([1] p. 42). Furthermore, some halos appear in the plate-Parry simulation which have not been observed in reality, e.g. a weak Kern arc complementing the circumzenith arc. At this stage the question may arise why only due to aerodynamics any symmetric hexagonal crystal (may it even be a column) should be able to place a pair of its side faces horizontally to generate Parry halos such as the HA and AA. Cross-like clusters or tabular crystals ([1] p. 42), from whose shapes one will immediately infer that rotations around the long axis are suppressed, seem much more plausible. Surprisingly, Walter Tape’s analysis of collected crystal samples shows that Parry halos are mainly caused by ordinary, symmetric columns. Parry orientations might be a natural mode of falling for small ice crystals, though up to now the aerodynamic reasons remain unclear. Nonetheless I tested if tabular crystals would give a bright AA. This was neither the case for moderate (height/width = 0.5) nor strong aspect ratio (height/width = 0.3). The AA was in both cases even weaker than in the symmetric standard simulation with which the discussion started.
Trigonal plates have been brought into discussion as possible crystal shapes being responsible for the Kern arc (see also [1] p. 102). Out of curiosity I tested how Parry oriented trigonal columns would affect the AA/HA intensity ratio. In contrast to symmetric hexagonal columns two different cases exist here, depending on whether the top or bottom face is oriented horizontally. As seen from the results, a sufficiently bright AA can be simulated using trigonal Parry columns with horizontal bottom faces, but the upper suncave Parry arc and the lower lateral Tape arcs at the horizon disappear. Obviously they have to, since a trigonal crystal in this orientation does not provide the necessary faces for their formation. On the other hand, the simulation predicts unrealistic arcs like the loop within the circumzenith arc. Choosing a trigonal Parry population with top faces horizontal will diminish the loop of the HA and wipe out the upper part of the AA as well as the upper lateral Tape arcs and add an unrealistic halo that sweeps away from the supralateral arc.
Is it possible to generate a realistic simulation of the Neklid picture with such crystals? Clearly this will require to add a second Parry population of symmetric hexagonal prisms. Doing so, a reasonable compromise can be achieved. In this case the hexagonal crystals produce the Parry arc, whereas the trigonal ones are responsible for the AA. Due to the triangular portion being small, the unrealistic halos become insignificant. However, the fact that a further degree of freedom (mixing ratio trigonal/hexagonal) has to be added to the set of initial simulation parameters is somehow dissatisfying.
The question lies at hand if this result might also be obtained by choosing a single Parry population of intermediate shapes between the symmetric hexagonal and trigonal extremes. This idea is further motivated through pictures of sampled crystals that, though being labeled „trigonal“, show in fact non-symmetric hexagonal shapes. The simulation for these shapes does indeed predict an enhanced AA compared to symmetric hexagons, but the lower lateral Tape arcs and the upper suncave Parry arc still appear too weak. This means that an additional set of symmetric hexagonal crystals is needed again to render these halos at the proper intensity.
Moreover, quite prominent unrealistic halos like the loop crossing the circumzenith arc appear in the simulation. If this assumption for the Parry crystal shape was right, this arc should be visible in an unsharp mask processing of the photos. Its absence hints that these crystals did not play a dominant role in the Neklid display. One could argue that the unrealistic halos may depend strongly on the actual crystal shape and might be washed out in a natural mixture of different “trigonalities“. However, the simulation tests indicate that even in this case the unrealistic halos remain rather strong, as long as one still wishes to maintain an AA at sufficient intensity.
As a conclusion, it can be stated that the intensity ratio between the heliac arc and the antisolar arc in the Neklid display as well as in Antarctic and Finnish observations has raised basic questions about the shapes of the responsible crystals. Simulations with symmetric hexagonal Parry columns, i.e. the standard shapes, render the AA to weak compared to the HA. Inclusions in the crystals and spatial inhomogeneities of the crystal distribution can be ruled out as the cause of this deviation. Plates in Parry orientation or a mixture of Parry oriented trigonal columns with horizontal bottom faces and hexagonal columns both result in a more realistic AA/HA intensity ratio. However, they introduce traces of unrealistic halos and are rather uncommon hypotheses: Plate crystals are not supposed to fall like this, and the existence of “true” trigonal crystals is doubtful. Moreover, the trigonal crystals need an accompanying set of standard Parry crystals to generate other halos like the upper suncave Parry arc.
So all in all the mystery of bright antisolar arcs cannot be regarded as solved at this stage. Since this halo species is very rare in free nature, it might be helpful to test perspex crystal models of different shapes in Michael Großmann’s “Halomator“ laboratory setup. Though the refractive index in perspex is higher than in ice, the basic relations between HA and AA stay the same. However the big challenge remains to collect and document crystals during such a display, e.g. with the methods described by Reinhard Nitze.
References
[1] W. Tape, Atmospheric Halos (American Geophysical Union, 1994)
[2] W. Tape, J. Moilanen, Atmospheric Halos and the Search for Angle x (American Geophysical Union, 2006)
Addendum
I missed an important piece of information from Finland 2008: The idea of trigonal crystals making Parry halos was already pointed out by Marko Riikonen in an analysis of the Rovaniemi searchlight display. In that case, even one of the halos that I termed “unrealistic“ was observed in reality, thus strongly supporting the trigonal interpretation.
Author: Alexander Haußmann


